Free trading journal template for Excel and Google Sheets
A trading journal template should do the maths for you, so all you do is type in the trade. Here’s a free one for Excel and Google Sheets: fill in the trade, and it works out your risk-to-reward, your result in R, your profit or loss, and your stats by setup, session and grade. No sign-up needed.
Download the free template (.xlsx)
What’s in the template
| Tab | What it does |
|---|---|
| Start here | How to use it in five steps, and the four rules that make a journal work. |
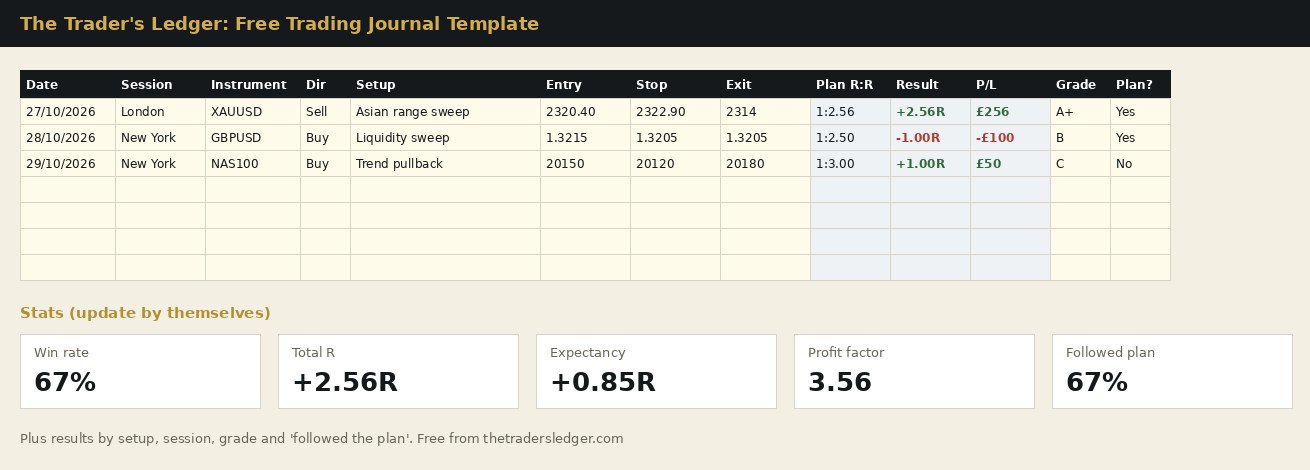
| Trade log | 300 rows. You fill in the cream cells: date, time, session, instrument, direction, setup, entry, stop, target, exit, lots, risk in £, grade and whether you followed your plan. The grey cells work out the planned R:R, the result in R, the P/L and win or loss. |
| Stats | Win rate, total R, expectancy, average win and loss, profit factor, total P/L and how often you followed your plan. Plus tables of your results by setup, session, grade and plan. |
| Setups | Your own list of setups, which feeds the drop-down in the log. It comes with twelve common ones (liquidity sweep, London breakout, pin bar, order block and more) that you can change. |
Three example trades are filled in so you can see the format. Delete them before you start.
The columns that matter most (and why)
- Setup. The single most useful column. After 30 or 40 trades it tells you which setups make you money and which ones quietly cost you. Your broker statement can’t tell you this.
- Result in R. R is your result divided by what you risked. A +2R win on gold and a +2R win on EUR/USD are the same quality of trade, even if the pounds differ. It’s the only fair way to compare trades. (More in risk to reward explained.)
- Session. Most traders do far better in one session than the others. The stats tab shows you which. (See forex market hours in UK time.)
- Grade. Grade the setup before you enter, from A+ to C. If your A+ trades make money and your C trades lose it, the fix is obvious.
- Followed plan? More important than win or loss. A losing trade that followed the plan is a good trade. A winning trade that broke it is a warning.
How to use it with Google Sheets
- Download the .xlsx file.
- In Google Drive, click New → File upload and choose the file.
- Open it, then click File → Save as Google Sheets. Everything, including the drop-downs and the stats, carries across.
On a Mac, it opens in Numbers too, although Excel or Google Sheets work best.
The honest downside of a spreadsheet journal
Spreadsheets are free and flexible, and for a lot of traders they’re the right place to start. The problem is that most people stop filling them in within a few weeks. A spreadsheet doesn’t remind you of your rules before you trade, doesn’t size the trade for you, and on a phone it’s fiddly. When logging feels like admin, it’s the first thing to go after a bad week, which is exactly when you need it most.
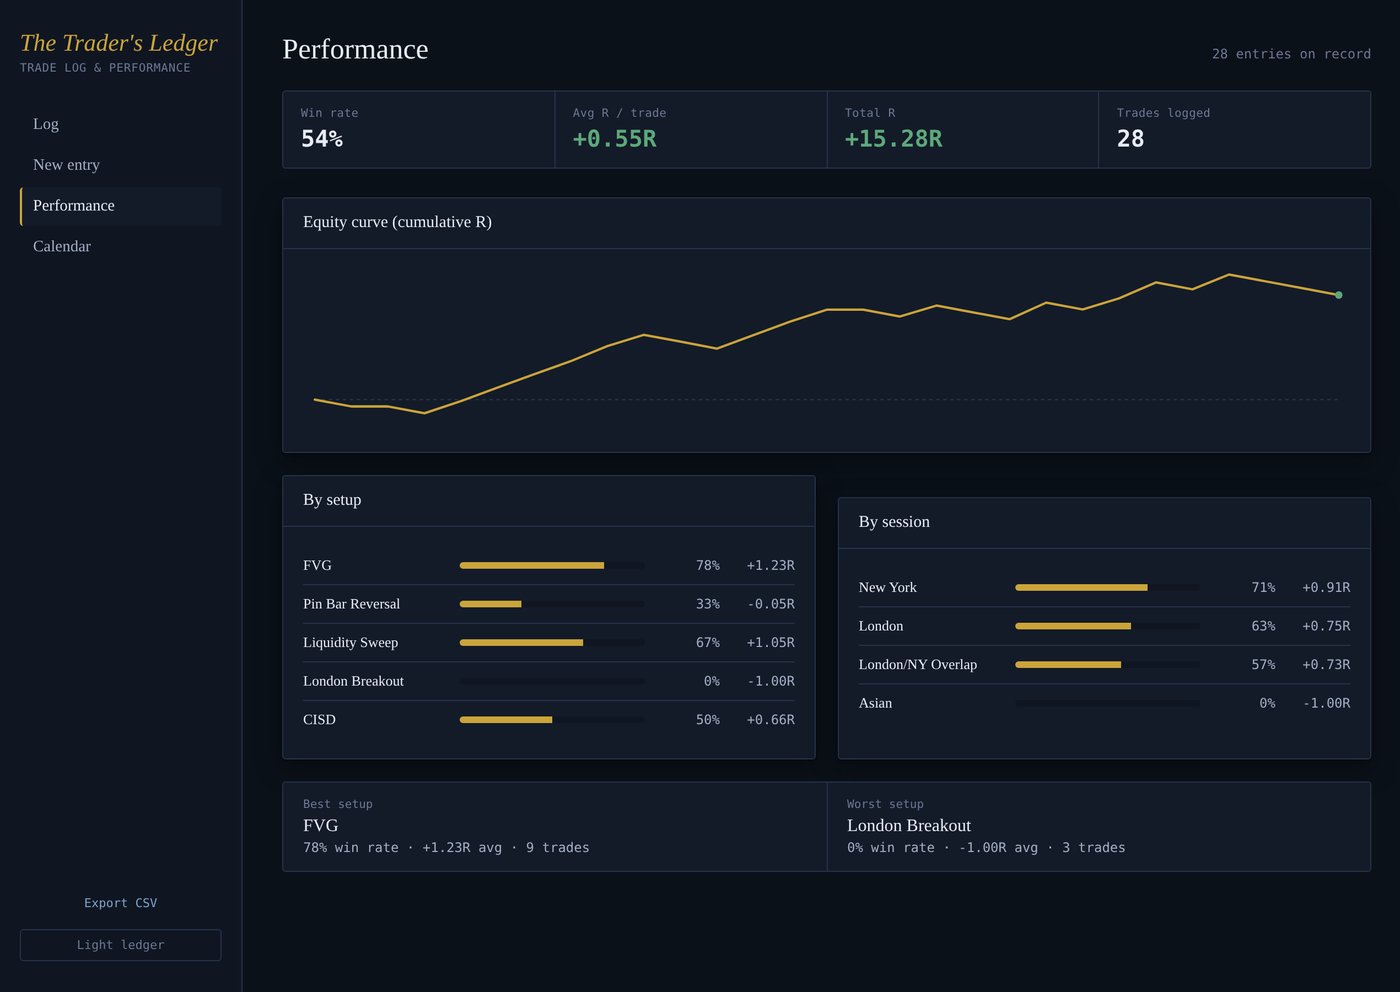
That’s why I built The Trader’s Ledger: the same idea as this template, but with the rules of each setup on screen, a pre-trade check that grades the trade before you take it, lot sizes worked out for you, and the charts drawn for you. Logging a trade takes about a minute.
Want a journal that does all of this for you?
The Trader’s Ledger runs in your browser with nothing to install: 25 written setup cards, a pre-trade check that grades every trade A+ to Skip, lot sizes worked out for you, your stats by setup and session, and a free 49-page trading course. £19 once, the launch price until 31 December 2026, with a 14-day money-back guarantee.
See The Trader’s LedgerNew to journaling? Read how to keep a trading journal and see trading journal examples of what to write.
Frequently asked questions
Is there a free trading journal template for Excel?
Yes. The Trader’s Ledger template is a free .xlsx file with a trade log, drop-down setups and sessions, and a stats tab that works out your win rate, R, expectancy and profit factor. It also works in Google Sheets.
What should a trading journal template include?
At minimum: date, instrument, direction, setup, entry, stop, target, exit, risk and result. The most useful extras are the session, a grade for the setup, whether you followed your plan, and a short note or lesson.
Can I use the template in Google Sheets?
Yes. Upload the .xlsx file to Google Drive, open it, and choose File then Save as Google Sheets. The formulas and drop-downs carry across.
How is R calculated in a trading journal?
R is the result divided by the amount risked. For a buy, (exit − entry) ÷ (entry − stop). A trade that makes twice what it risked is +2R; a full stop-out is −1R.
Educational content only, not financial advice. Trading carries a high level of risk and you can lose more than you expect. Examples use illustrative prices.