Liquidity Sweep
Liquidity & structureWhen: Price runs an obvious swing high or low, then closes back inside the range.
Spot it with 4-Step Pro
The Trader's Ledger is a single-page trading journal that runs in your browser. Log every entry, exit and reason — it does the maths on your win rate, your average R and your equity curve, so the pattern shows itself.
Launch price £19 until 31 December (then £39) — one-time payment, yours to keep. No app to install.
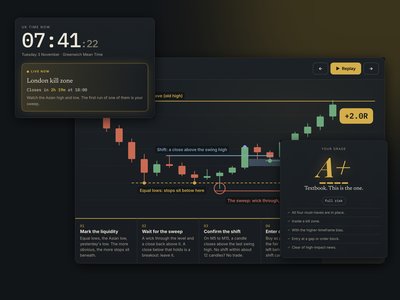
A live UK session clock, the setup animated step by step, an A+ to Skip trade grader and a lot size calculator. Plus a printable PDF.
The Asian range, the London and New York kill zones in UK time, yesterday's high and low and a live session clock, right on your chart. Sweep alerts included.
Stop collecting strategies. Start running a system. Four parts, one loop, built to make you consistent.
The top 25 rule-based setups, each with a chart diagram and clear entry, stop, target and skip rules.
MT4 & MT5 indicators linked to the setups they find, plus a risk:reward planner for perfect lot sizes.
Every trade logged by setup, session and indicator, with your win rate, R and equity curve.
See what FOMO, revenge trades and broken rules really cost you, in your own numbers.
A lot of trade journal software charges a monthly fee — often £20 to £40 — before you've proven a single setup works. On a four-figure account, that's a real percentage of your capital gone before the month's first trade.
So people default to a spreadsheet, which works for about three weeks. No win-rate maths, no equity curve, no reason to open it once the novelty wears off — and the one habit that actually improves a trader's results quietly stops.
Three losses on the same pattern look like bad luck in your head. Lined up in a ledger, on consecutive rows, they look like a setup you need to drop.
Most traders overestimate their win rate by a wide margin because losses are easier to forget than wins. The ledger doesn't forget either one.
Tag entries by setup and instrument, and it stops being a guess whether a losing month was market conditions or a pattern in how you're trading it.
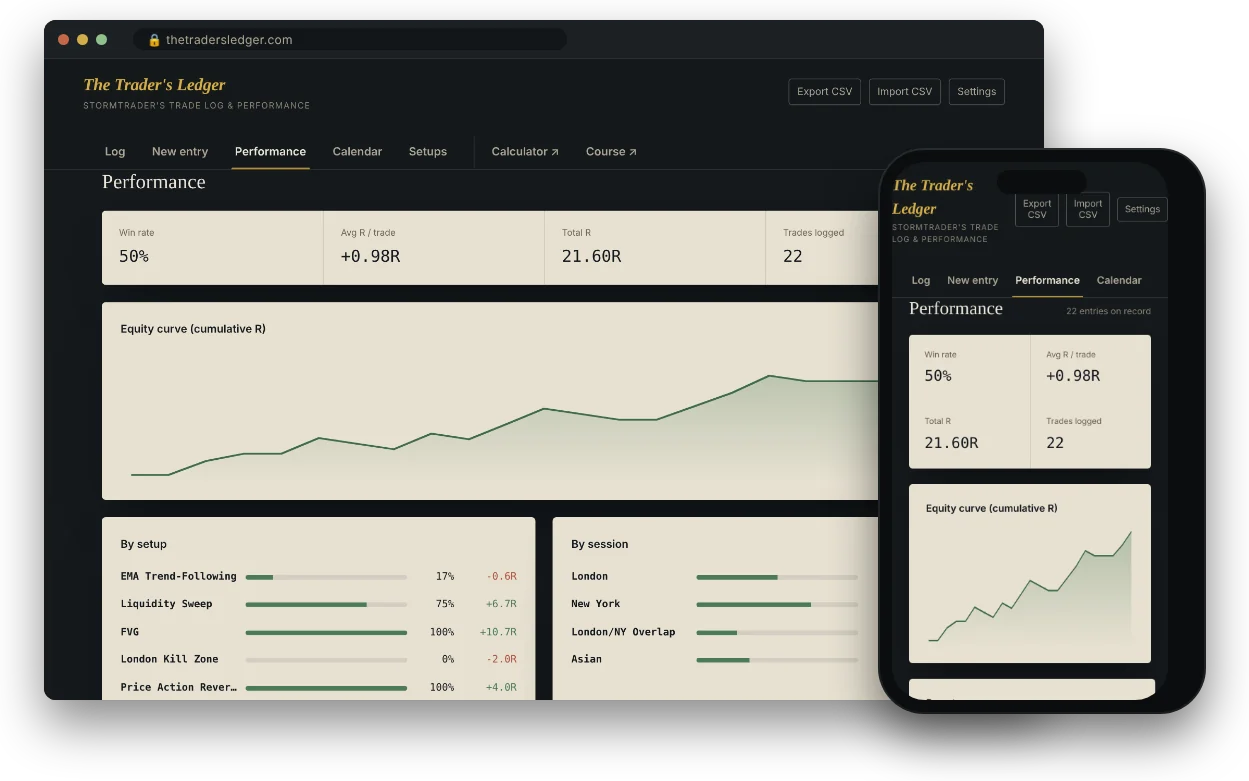
The Trader's Ledger is a single self-contained web app — open it and you're straight into the log. There's no account to create and no cloud sync pulling your trade history through a third party. Your entries live in your own browser, on your own device.
Entry, exit, size, direction and R multiple for every trade, in rows you can scan in seconds.
Win rate, average R, profit factor and equity curve, recalculated the moment you log a trade.
Tag each entry by strategy or instrument, then filter to see which ones are actually earning their place.
A field for the reasoning, not just the numbers — so you can review the decision, not just the result.
Pull your full history out at any time for your own records, tax prep, or a spreadsheet deep-dive.
Nothing to sign into, nothing syncing your positions to a server you don't control.
See what a fixed daily pip target actually turns into over months, with position size scaling up as your balance grows. See a preview →
Tick eight quick checks as you log a trade. The Ledger grades it, then shows whether your A+ trades really pay you, and what the trades you should have skipped cost.
Enter your entry, stop and risk %, and the Ledger fills in the lot size from your balance. Forex, gold, silver, crypto and the main indices.
A strip across the top tells you which London or New York kill zone is live and when the next one opens, in UK time. Use the TTL Hybrid indicators? Connect MetaTrader once and new signals arrive on their own, with an alert.
Every setup comes with a chart diagram and clear rules: when to take it, entry, stop, target, and when to skip it. Pick one when you log a trade, and the Ledger tracks how you actually perform with it.
When: Price runs an obvious swing high or low, then closes back inside the range.
When: A displacement candle leaves a fair value gap in the direction of higher-timeframe bias.
When: Price opens outside the previous session's value area, tests back into it, and rejects.
When: A new impulse leg breaks structure, then retraces into the 62–79% Fibonacci zone.
Matching indicators are available on the Indicators page.
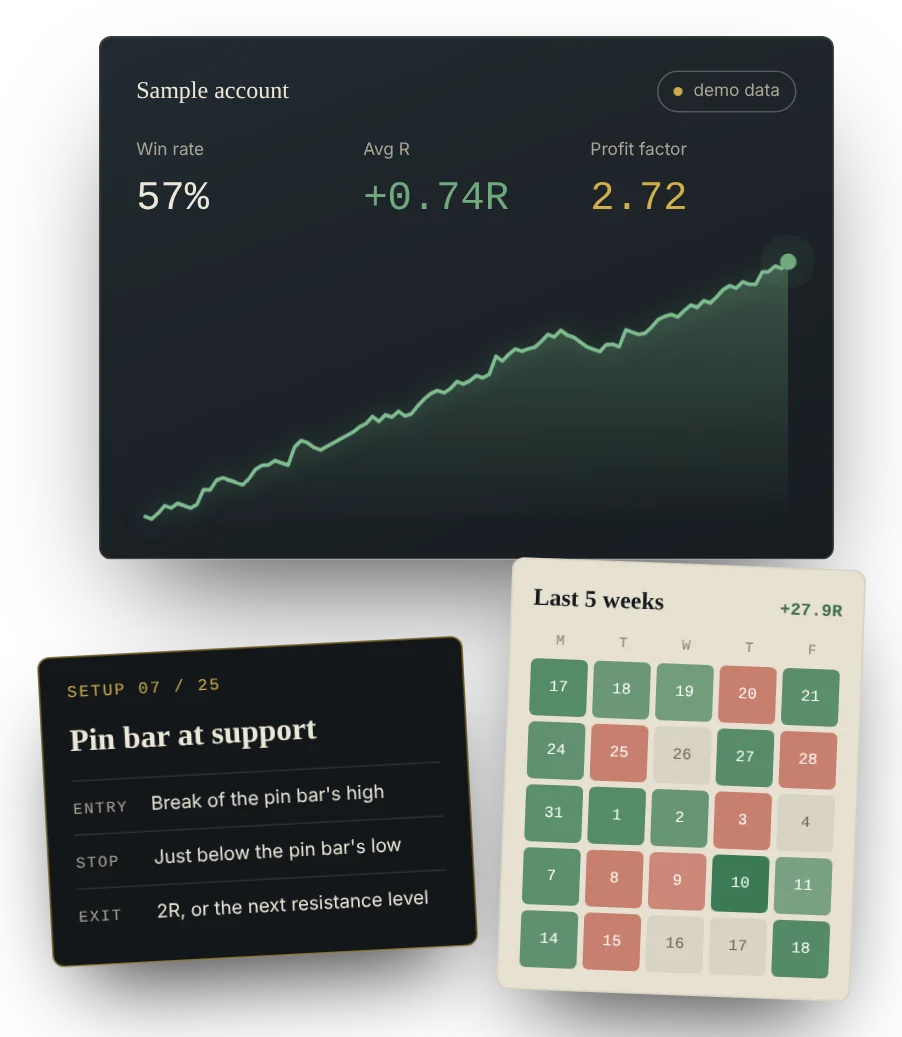
A sample account run through the ledger from April to September — the same calendar, equity curve and breakdown you'd see with your own entries.
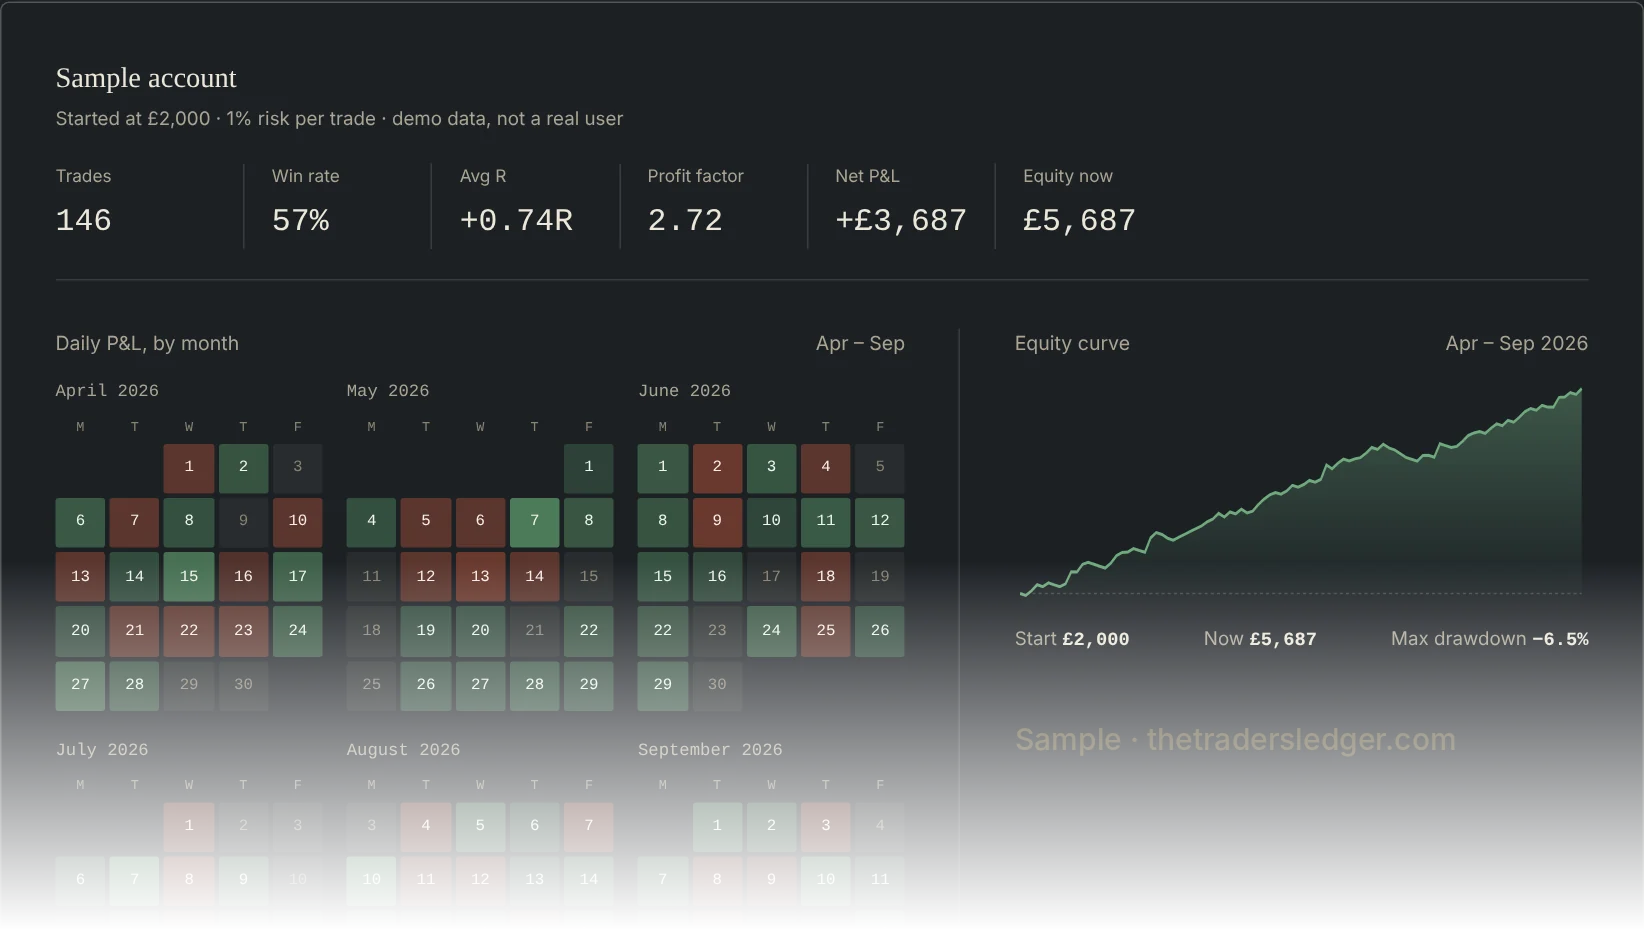
The full calendar, the equity curve and the breakdown by instrument, setup and session are all inside the Ledger. Get it for £19 →
This is generated sample data for illustration, not the record of a real trader — it's here to show the calendar, curve and breakdown views, not to promise a result. Trading involves risk of loss; past performance, simulated or real, doesn't guarantee future returns.
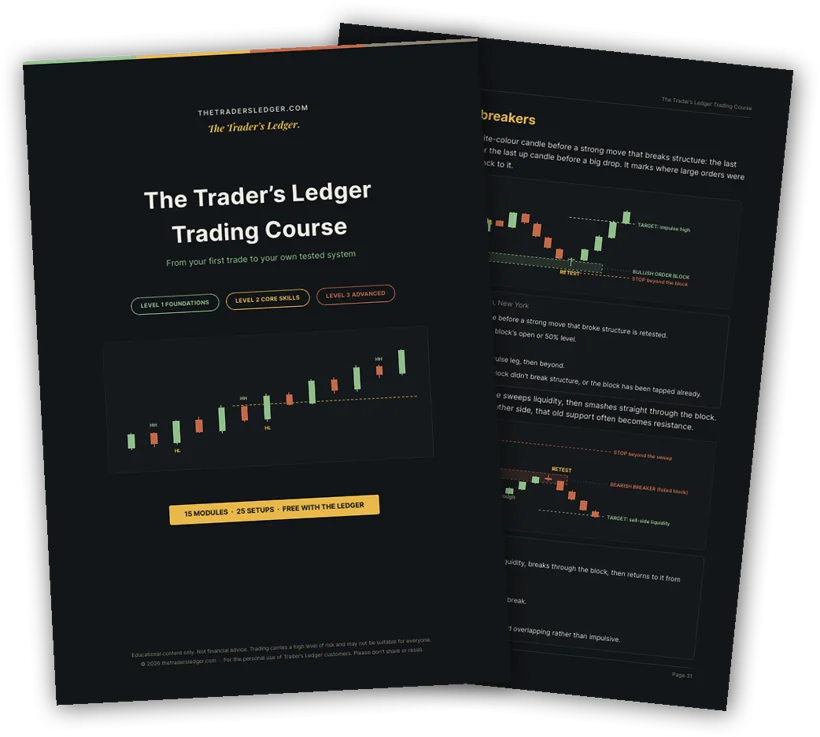
A 49-page course that takes you from your very first trade to your own tested system, with over 40 chart diagrams. Every setup in it matches a setup card in your ledger, so everything you learn, you can log and measure.
I’ve been around markets my whole life. My father was a broker for 40 years. I worked on client investments from the late 1980s, and I was designing software in COBOL in the early 90s. Everything I learned in that time went into The Trader’s Ledger, and the lesson underneath all of it is simple.
You can’t shortcut discipline. A 20-minute video can show you a setup. It can’t make you consistent.
That’s what the Ledger is for. It has you trade a written plan, log every trade against your setups, and see in your own numbers what really works for you and what doesn’t. You won’t win every trade; nobody does. But with proper risk management and a positive risk-to-reward, the losses become part of the plan instead of the end of it.
I’ve priced it at £19, once (the launch price until 31 December, then £39), with every future update included, because the traders who need it most are often the ones who’ve already lost money finding that out. And if it isn’t for you, there’s a 14-day money-back guarantee.
Most traders start a journal and give up within a fortnight, because it’s a fiddly spreadsheet. The Ledger does the boring bits for you, so logging a trade takes about a minute.
One payment, yours to keep · 14-day money-back guarantee
One-time purchase either way. Yours forever, no subscriptions.
Launch price £19 until 31 December 2026. The Ledger goes to £39 on 1 January.
For comparison, TradeZella costs from $26 a month. The Ledger is £19, once.
No. The ledger runs at Thetradersledger.com as a single page — no download, no app store, no server-side account to set up.
It's stored in your own browser on your own device. Nothing is uploaded to a server as part of using the ledger, so it's private by default. You can export a CSV backup any time.
No. It's a one-time payment of £19 — no renewal date, no recurring charge. You pay once and the ledger is yours to keep, permanently.
Any of them. You enter your own instrument, direction and price for each trade, so it works for forex, indices, metals, crypto or shares equally.
Yes — CSV export is built in and isn't gated behind anything, so your history is always yours to take with you.
No. The ledger is a record-keeping and analysis tool. It doesn't place trades, recommend setups, or guarantee results — what you do with the numbers is still on you.
£19 launch price until 31 December, paid once. Open your first entry today.
Buy for £19