The previous day high and low strategy (PDH and PDL), explained
Ask ten intraday traders which levels they mark every morning and nearly all will say the same two: yesterday’s high and yesterday’s low, the PDH and PDL. They’re simple, everyone can see them, and that’s exactly why they work: stops and breakout orders pile up just beyond them.
Where does “yesterday” start?
This trips people up. Most brokers close their daily candle at 17:00 New York time, which is 22:00 UK (21:00 in the clock-change gap weeks). So “yesterday” on most MT4 and MT5 charts runs from 22:00 UK the night before to 22:00 UK. If your broker’s daily candle closes at midnight UK instead, your PDH and PDL will differ slightly from everyone else’s. Use a broker on New York close if you can; it’s what most of the market sees.
The two ways to trade them
1. The sweep. Price runs above the PDH (or below the PDL), takes the stops, and closes back inside. It’s the same pattern as the Asian range sweep, one level further out, and it’s at its best when it happens in a kill zone. The target is the middle of yesterday’s range, then the other side.
2. The break and retest. Price closes beyond the PDH and holds. The old high often becomes support on the first pullback. You buy the retest, with the stop back inside yesterday’s range.
| Sweep | Break and retest | |
|---|---|---|
| Signal | Runs the level, closes back inside | Closes beyond and holds |
| Entry | After the structure shift back inside | On the pullback to the old level |
| Stop | Beyond the sweep’s extreme | Back inside yesterday’s range |
| Best when | Into a higher-timeframe level, in a kill zone | With the higher-timeframe trend, after news |
Combine it with the Asian range
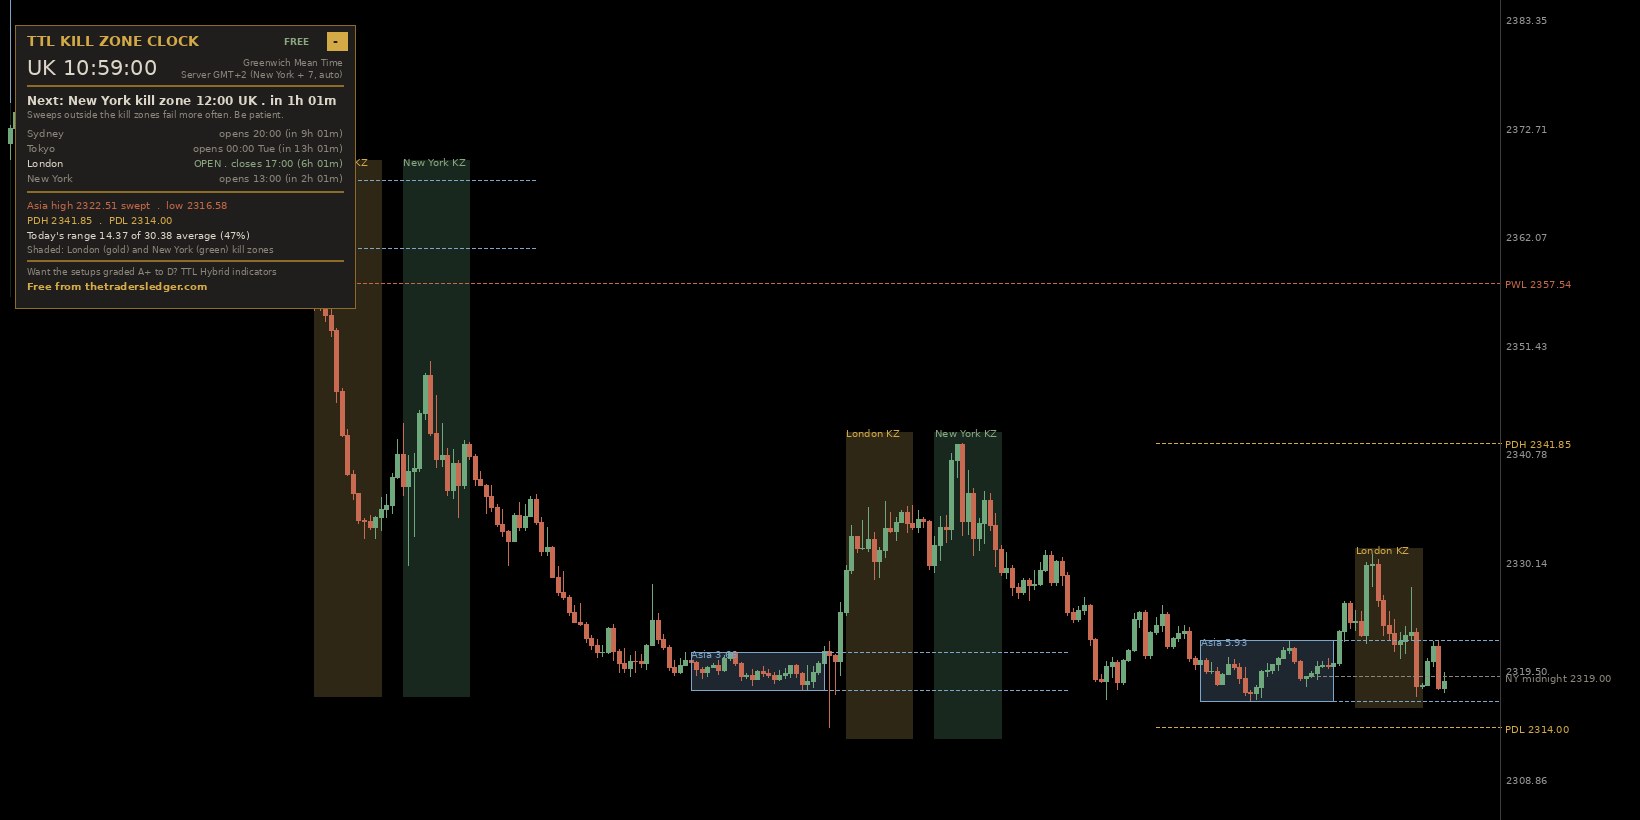
The best mornings stack the levels. If the Asian low sits just above yesterday’s low, a London sweep that takes both clears two pools of stops at once. Those are the sweeps worth waiting for. Last week’s high and low (PWH and PWL) are the next layer out, and the New York midnight open is a handy line for the day’s bias: above it, buyers are in control; below it, sellers.
A quick routine
- Before London, mark the PDH, PDL, the Asian high and low, and last week’s high and low. (Or let the indicator do it.)
- Note which level is closest to price, and whether the higher-timeframe trend points at it.
- In the London kill zone, wait for the first level to be run, then read the close.
- Size the trade to the stop with the lot size calculator, and log it.
Get yesterday's and last week's levels drawn for you, free
The TTL Kill Zone Clock draws the Asian range, the London and New York kill zones in UK time, yesterday’s and last week’s highs and lows, with a live UK session clock and sweep alerts. Free for MT4 and MT5, and it handles the clock changes by itself.
Download the Kill Zone Clock freeFrequently asked questions
What is PDH and PDL in trading?
The previous day’s high and the previous day’s low. Intraday traders watch them because stop orders and breakout orders tend to sit just beyond them.
What time does the previous day start in forex?
On most brokers the daily candle closes at 17:00 New York time, which is 22:00 UK (21:00 in the clock-change gap weeks). So yesterday runs from 22:00 UK to 22:00 UK.
Is it better to trade the sweep or the break of the previous day high?
Neither is always better. A sweep that closes back inside, in a kill zone and into a higher-timeframe level, favours the reversal. A strong close beyond the level that holds, with the trend, favours the break and retest.
Is there an indicator that draws the previous day high and low on MT4 or MT5?
Yes. The free TTL Kill Zone Clock draws yesterday’s and last week’s highs and lows, marks them as swept when price runs them and can alert you. Download it from thetradersledger.com/free/kill-zone-clock/.
Educational content only, not financial advice. Trading carries a high level of risk and you can lose more than you expect. Examples use illustrative prices.